‘Fancy’ doesn’t always equal ‘better’.
In fact, you’ll probably be surprised how much money even really “OLD” stuff can make.
I want to share with you a very old indicator, that most algo-traders probably haven’t touched for years. It’s simply “too obsolete” for many.
Yet, it keeps proving to be a really great one.
The indicators name is…
Williams %R.
The indicator is designed by famous trader Larry Williams. It’s a momentum oscillator that moves between 0 and -100 and measures overbought and oversold levels. The indicator is very similar to the Stochastic oscillator and is used in the same way. It compares a stock’s closing price to the high-low range over a specific period, typically 14 days or periods.
Want MORE? Sign up for the free BTA newsletter and join 1000’s of other traders who receive meaningful trading content every week, straight into your email inbox. Click here to join us.
And even though I also consider it a little “obsolete” for my own algo-trading (I mean no respect to Larry Williams, I love his work and have ALOT of respect for him as a trader), here’s a surprising twist:
Recently, my hedge fund guy in charge of strategy and portfolio development (who is also a former student of mine) had an idea to look at some of his first trading strategies. Trading strategies that he developed years ago, before he started working for my hedge fund.
And one strategy really got his (and my) attention.
It was a simple breakout strategy based on my breakout model (you can learn my model in the free 14-day breakout strategy challenge). But with one simple tweak – it used the Williams %R indicator as a filter. (And no, I don’t have this indicator on my list of breakout filters, but that’s about to change).
In fact, this strategy was not completely new to me – I still remember how he first shared it with me about 4 or 5 years ago. I just didn’t pay much attention at the time and completely forgot about it.
But since then…
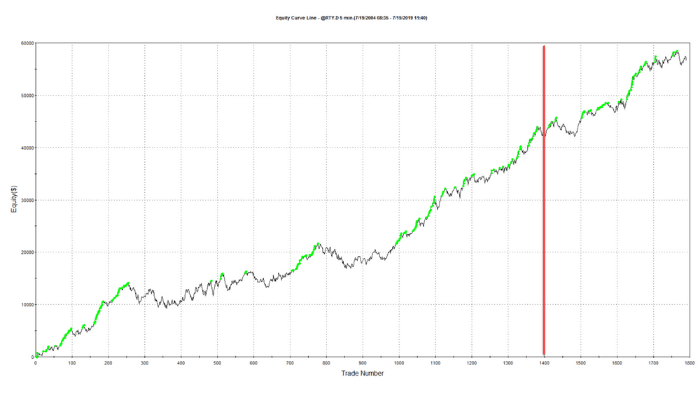
Well, have a look yourself:

The red line is approximately where I last saw the strategy.
Since then – it keeps making good money!
Definitely not bad, considering the application of the William %R indicator in the strategy is a very simple and basic one – just waiting for a signal to be in the oversold area for long and in the overbought area for short.
So, here are my two cents about this recent surprise:
| 1. | I think I’ll add Williams %R to my private list of indicators for breakout trading strategies. |
| 2. | I will definitely dig deep into my memory and think about other “obsolete” things I used to use in my discretionary trading, that may apply nicely to my algo trading now. |
In fact, obsolete stuff that most traders don’t use anymore can be pretty magical. And they can be easily added and tested in my breakout model too. (Again, you can learn my breakout model in the free 14-day breakout strategy challenge).
And you never know. It’s not always the latest that’s the greatest.
Happy trading!
Tomas
How To Start Creating Profitable Breakout Strategies In 2 Weeks Without Spending More Than 35 Minutes A Day
✓ The simple but incredibly powerful process to building profitable breakout strategies really fast,
✓ The 5 key components you need to create a good quality breakout strategy,
✓ How the power of automation can slash the time and effort you need to create loads of breakout strategies quickly and easily,
✓ How to tell if a breakout strategy is worth trading or is just over-fit rubbish,
✓ Start generating profitable breakout strategies in under 14 days without spending more than 35 Minutes A Day.


![[Automated trading] What’s stopping you?](https://bettertraderacademy.com/wp-content/uploads/2018/04/83770750_m-min-e1542143263854.jpg)


