I know everyone is talking about Coronavirus right now…
But I have something worth talking about as well.
Last week we finished a super exciting study in my Hedge Fund.
We took 600 Robustness Level 3 breakout strategies from our database. (Robustness Level is a proprietary way to measure the robustness of a trading strategy that we share in the Breakout Masterclass, and level 3 is the highest robustness level possible).
ALL of the strategies were created 4-5 years ago. So, these strategies have 4-5 years of TRUE out-of-sample history. The market data simply didn’t even exist during the time we created these strategies.
And that means a potential goldmine. Because, thanks to this true out-of-sample data, we can learn SO MUCH.
So, last week we spent time analyzing all these strategies and figuring out what were the most important elements behind the strategies that kept having superior performance (and matching the in-sample performance as much as possible) over those 5 years.
We came to many interesting and highly valuable conclusions, here are some of them:
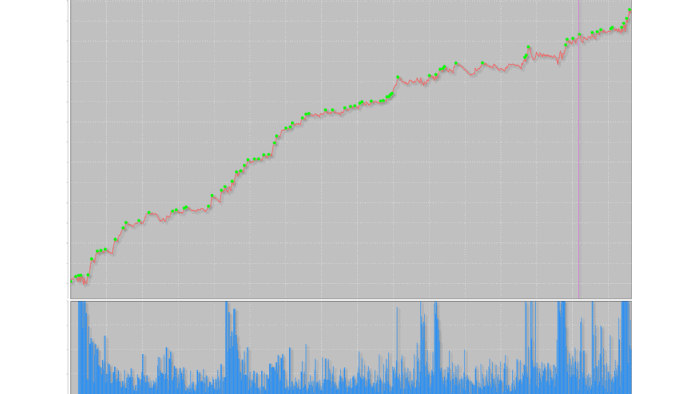
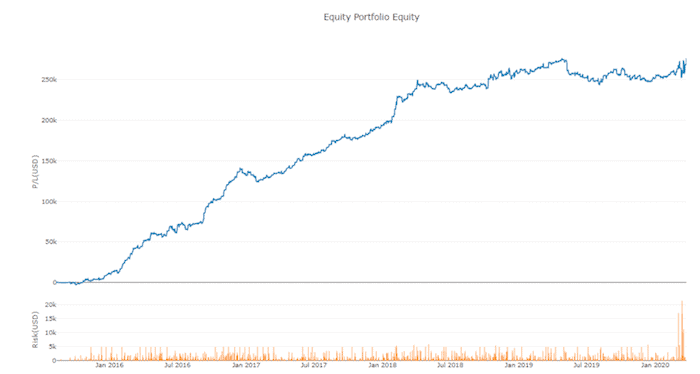
1. On average, the strongest strategies kept performing well.
In our framework (the same framework I teach in the Breakout Strategies Masterclass), we work with 3 different robustness levels. The strongest group, with Robustness Level 3 (and a few other robustness criteria we have when assembling the final portfolio), produced very reliable true out-of-sample results:
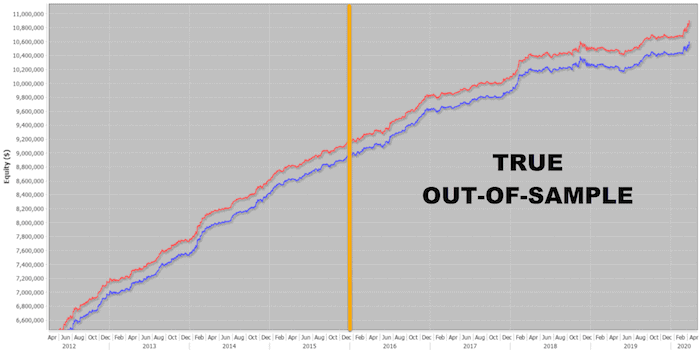
This amazing result was another confirmation of the reliability of the entire framework and came at the right moment, as our hedge fund is receiving more and more funds and we need to have super high confidence to put all this money into the markets.
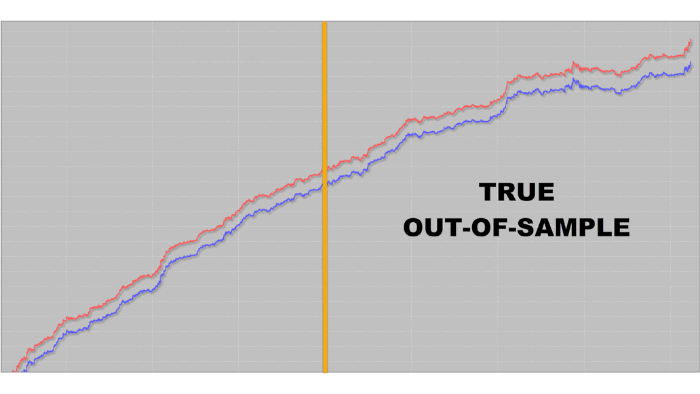
2. The higher the Profit Factor, the worse the true out of sample performance.
Many traders “fish” for high Profit Factor (PF). In the past, I used to have poor live trading results with strategies with a high PF.
One of the many tests we did was take all the strategies from the database, make a standard distribution of PF, and then analyze how well strategies performed based on their PF compared to the mean, more to the left side, and more to the right side.
The conclusion was pretty straightforward – the higher the PF, the worse the true out-of-sample performance. Here are all the strategies with PF > 1 Standard Deviation:
This was pretty important analysis, because:
a) it confirmed the very specific Profit Factor value that I share in the Breakout Strategies Masterclass as the recommended ‘baseline’ (which we figured out through research years ago),
b) it gives us a better idea how to be more efficient in the final strategies selection (preferring strategies with PF around the mean).
And finally…
3. In the research, we found out one metric stood out as being the key parameter for reliable out-of-sample performance.
This metric came out independently in several different assessments and showed to be the SINGLE MOST IMPORTANT METRIC when it comes to the quality of the real out-of-sample performance.
It was pleasing to see that now we can put even more focus into one simple metric and start producing even more robust strategies.
I decided to leave this metric for the students of the Breakout Strategies Masterclass, so, if you’re a part of our Breakout Masterclass family already, look forward to a video with the latest update I plan to release in the Masterclass in a few weeks (we’re still working on a few more additional analysis, so I plan to record it and share it as soon as we finish it).
Either way, the treasure one can get when assessing past true out-of-sample performance, is truly priceless. Another reason to always have A LOT of strategies in your database – in a few years from now, they will give you MANY great answers. (And of course, you can create hundreds of these strategies with the Breakout Masterclass too).
I can’t wait to see how much more priceless information we find out from our analysis…
Stay safe and happy trading,
Tomas
7 Proven Tips to Build Profitable Breakout Strategies FAST
✓ Key components to building better breakout strategies faster than ‘normal’
✓ The most common mistakes breakout traders often make that costs them money – don’t let these catch you out
✓ How to choose the best markets and timeframe for quicker and more consistent results
✓ The shockingly simple technique to fast-track your breakout trading progress in just days


![[VIDEO] Why do You trade?](https://bettertraderacademy.com/wp-content/uploads/2019/02/11.feb19v2-min.png)
![[VIDEO] How to build strategies upside down](https://bettertraderacademy.com/wp-content/uploads/2019/03/18mar19-min.png)