Last week I received a good question from a reader of my personal trading blog SystemsOnTheRoad.com.
In this email, a trader Kevin asks which chart is better:
Time-based, or tick chart?

First, let me share directly, that for most traders this question is not even relevant.
The reason is simple:
To build robust trading strategies, we always need a good sample size.
I personally am very firm on backtesting on at least 8-10 years of data history. With a target of at least hundreds of Walk-Forward trades as a sufficient sample size. (And the closer to 1,000 trades the better).
Unfortunately, many backtesting platforms offer tick-based data with only 6 – 24 months of data history. Which is insufficient.
But…here’s another side of this coin too.
And this side needs to be considered as well:
If something is mostly inaccessible, then by its nature that could suggest a possible trading advantage or an extra edge.
In other words, if the usual trading herd can’t have it, it could be worth exploring further. (Btw. this is how I assembled an extra powerful trading edge with Market Internals. Knowing that for many traders Market Internals might not be accessible. Or don’t even know that Market Internals exists. Or how to use it properly).
So, about 5 years ago I invested a STUNNING amount of money and purchased 8 years of tick data history. For most futures markets, for a lot of indices, and some CFDs.
Unfortunately, this big investment never paid off.
Although I admit there can be some really strong advantages in tick-based data, working with them can be a huge disadvantage.
Want MORE? Sign up for the free BTA newsletter and join 1000’s of other traders who receive meaningful trading content every week, straight into your email inbox. Click here to join us.
First of all, backtesting on tick data is painfully slow. PAINFULLY. It took me easily 20-50 times longer compared to regular time charts, like 30-minute bars. And, it was highly unstable too. Most backtesting platforms are not well equipped to hold such a huge amount of data and work with it reliably. And tick-based data was HUGE. And finally, there were some real trading challenges too. For example, some ticks seemed to be “lost” due to internet latency, so the live tick-based chart didn’t match the backtesting! In other words, tick-based charts are much more sensitive to things like internet quality (compared to more robust time-based charts).
So, simply said, there was too much hassle which did NOT compensate the advantage of tick-based data.
That’s also why we haven’t used tick data in our hedge fund yet either. Especially due to the speed issues.
This year we learned that to build a truly powerful, well-diversified portfolio based on 10 strategies, you easily need 100-200 high-quality strategies to choose from. To get a really cutting-edge, well-balanced portfolio result. (We built these strategies with the Breakout Strategies Masterclass framework and with additional automation).
But to get 100-200 high-quality strategies on tick-based data, could easily take a whole year or longer, which is a luxury we don’t have.
Besides, I have been always able to deliver superior trading results with time-based charts. They deliver all I need. I don’t need anything extra when it comes to timeframes to build a really great portfolio.
The true secret of good trading results is not in the type of trading chart you use. It’s in the robustness of your trading strategies, building great portfolios, and smart (dynamic) position sizing.
So, that’s where I’d recommend Kevin to spend his time. Aim for a smooth equity curve and a stable distribution of trading profits through a good, well-balanced portfolio, not through individual trading systems or fancy charts.
Happy trading,
Tomas
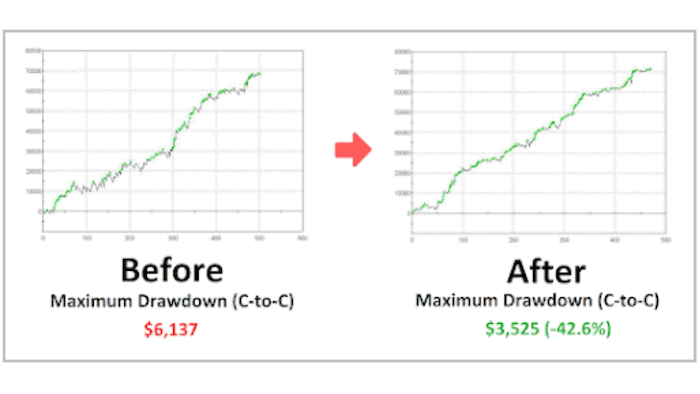
Sick of long and painful drawdowns?
 ✓ 5-step framework you can use right away to improve your trading performance
✓ A proven solution to slash drawdowns by up to 50%
✓ Applicable for index futures, stocks, and ETFs
✓ Quick and easy to implement
✓ You get the strategy code, so you can do it yourself!


![[VIDEO] Beat the markets with better ideas](https://bettertraderacademy.com/wp-content/uploads/2018/06/Beat-the-markets-with-better-ideas2-1-min.png)
